OzCrest Minerals Limited - Exploration Work
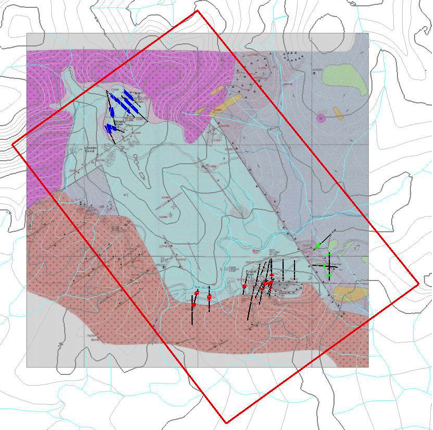
| OzCrest’s independent geologist, has produced a comprehensive report on the main target areas within the project being the Eclipse and Paisley zones. In all slides Paisley is at the upper end and Eclipse in the lower. This figure displays a map of the local project geology produced by one of the past explorers, Normandy Exploration. The pink and purple areas around the top left and bottom are the granitoid intrusive. The red box marks the Muldiva Project area. The black lines are traces of old exploration drill holes. |
| A gridded DTM surface was interpolated from the contour and stream data, using a trending algorithm. The figure illustrates the topography surface in perspective view, looking NW down 30°. The following figures show colour coded contour maps of the model of each element. High values are the hotter (red) colours, low values the cool (blue) colours. Black lines are a 100*100m coordinate grid. |

